Show the points behind every rank
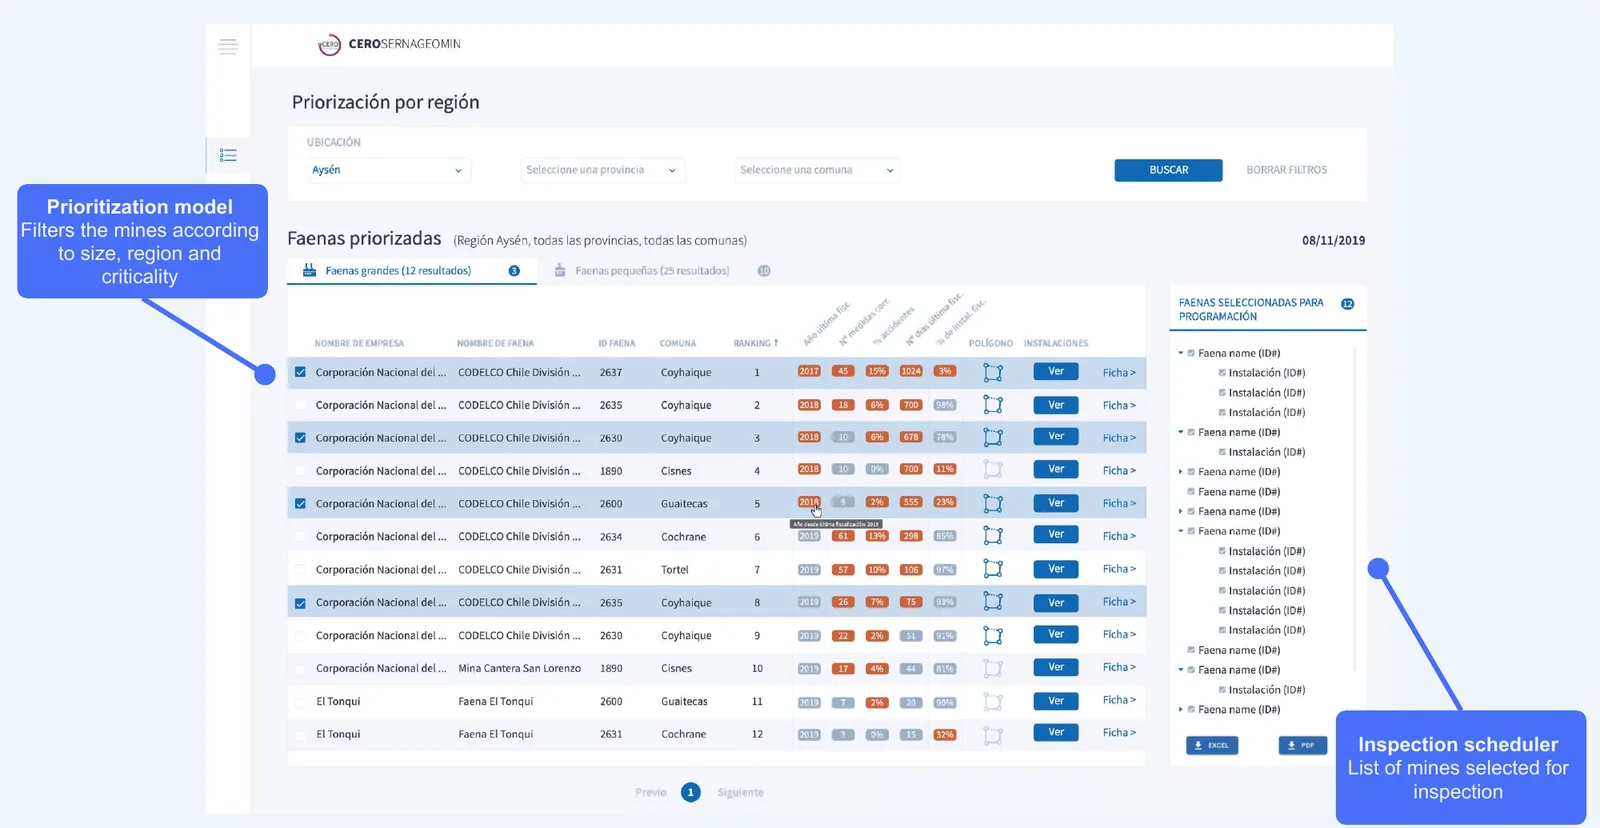
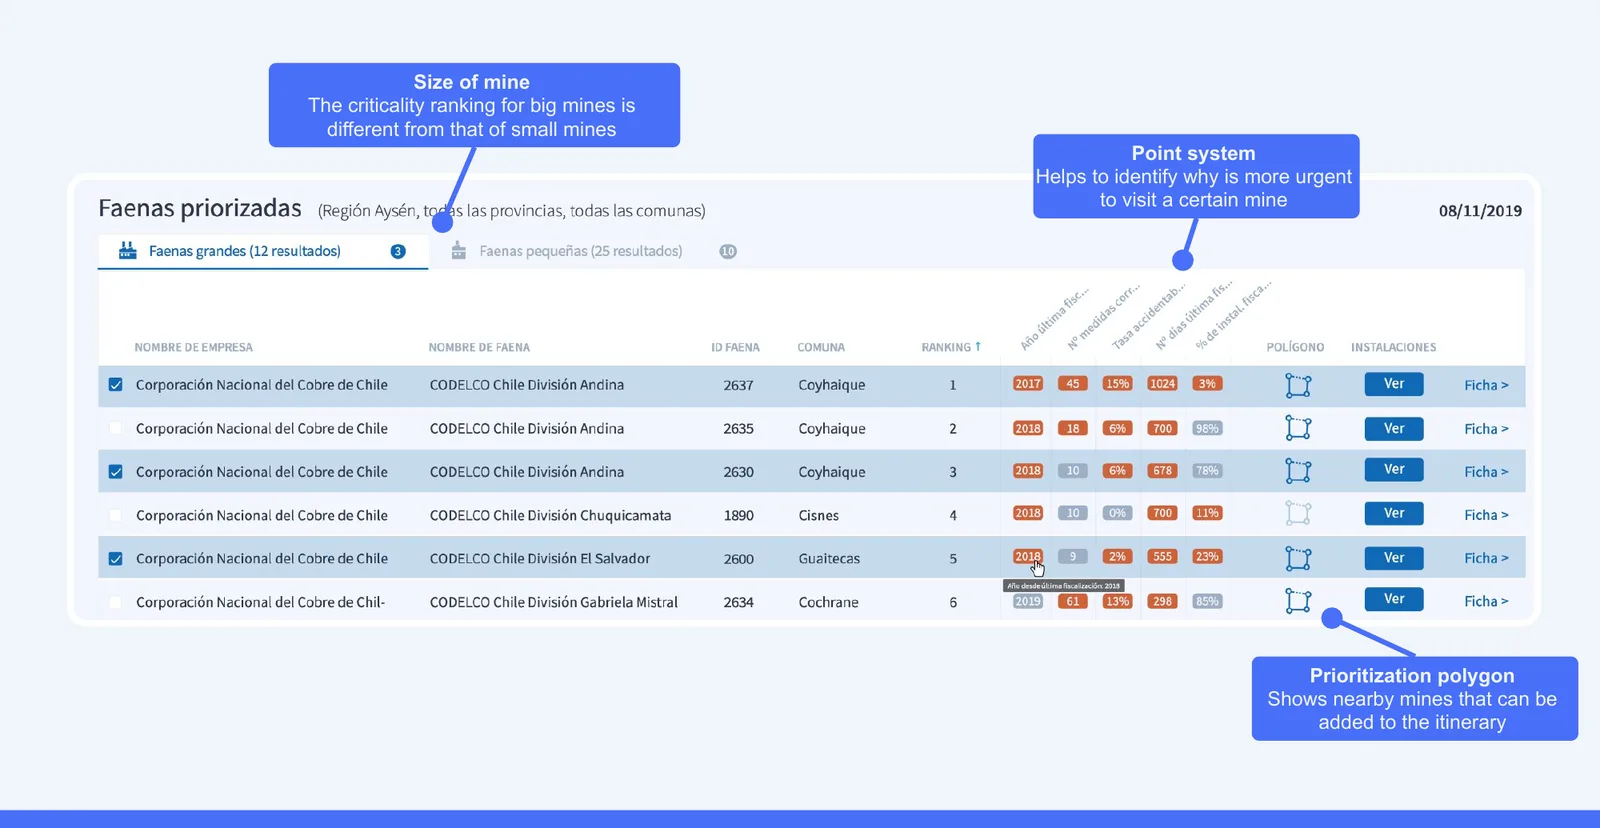
ExplainabilityEach mine's score breaks into four categories. Years since the last inspection weighs most, then pending corrective measures, so inspectors can see and question the reason.
Chile's mining safety agency had about 50 inspectors for 3,905 mines. A model ranked every mine by risk; I designed the tool that shows inspectors why each mine ranks where it does, so they could plan their visits by it.
Mining is more than 14% of Chile's GDP and more than half of its exports. SERNAGEOMIN inspects mines to prevent accidents, but with about 50 inspectors and 3,905 mines, each visit has to count. The agency wanted to move from preventive, calendar-based inspections to predictive ones, based on data.
I led the design: research, information architecture and interface. With the ontology researcher I built the information architecture that became the base for both the data-entry process and the predictive model. The data scientist built the model; the developer built the platform.
Inspection records weren't digitized. Deciding where to go relied on inspectors' experience. Of the 3,905 mines, 1,316 were medium or small and about 15% were inactive, so a simple list gave little guidance.
A ranking alone wouldn't be enough: inspectors are experts, and they won't follow a number they can't explain.
I ran five sessions with the inspection coordinator and joined an inspection. Inspectors worked with a flashlight in hand and paper documents, and did the final review outside the mine, in bad light.
Each mine's score breaks into four categories. Years since the last inspection weighs most, then pending corrective measures, so inspectors can see and question the reason.
A small mine and a large one carry different risks. Mixing them would push every small mine to the bottom.
A prioritization polygon groups nearby mines, so one trip covers several high-risk sites.
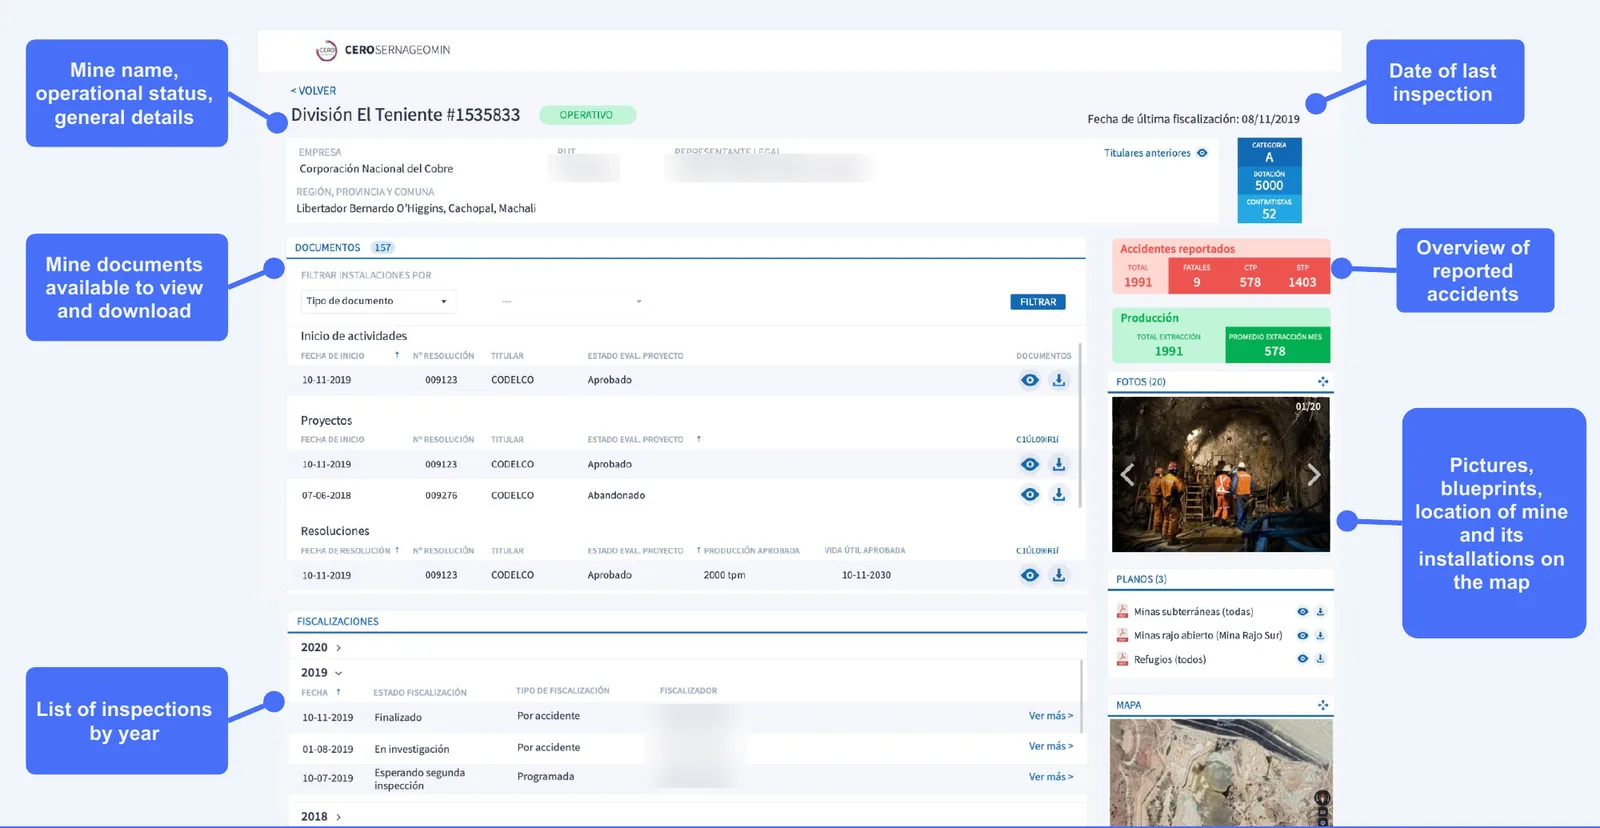
The client's draft spread a mine's data across tabs. I merged it into one chart that reads top to bottom.
SERNAGEOMIN's wider Zero Accident program also reported 50% fewer fatalities. That's a program result with many causes, so it isn't claimed here as this tool's impact.
Going to the mine. Seeing the light, the paper and the travel changed what the scheduler had to do.
I worked part-time, which opened a gap between design and implementation. Today I'd stay closer to the front-end.