L.O.V.E.A control room for a telescope still being built

For four and a half years I designed the operators' interface for the Vera C. Rubin Observatory, before its main users, its data or much of its hardware existed. We built it as a framework, so Rubin's own team could keep extending it.
Client
Rubin Observatory (AURA), via Inria Chile and France
Years
Jun 2017 – Sep 2021
Role
Lead UX designer
Team
Me, 3 developers, 1 project manager
Status
Shipped
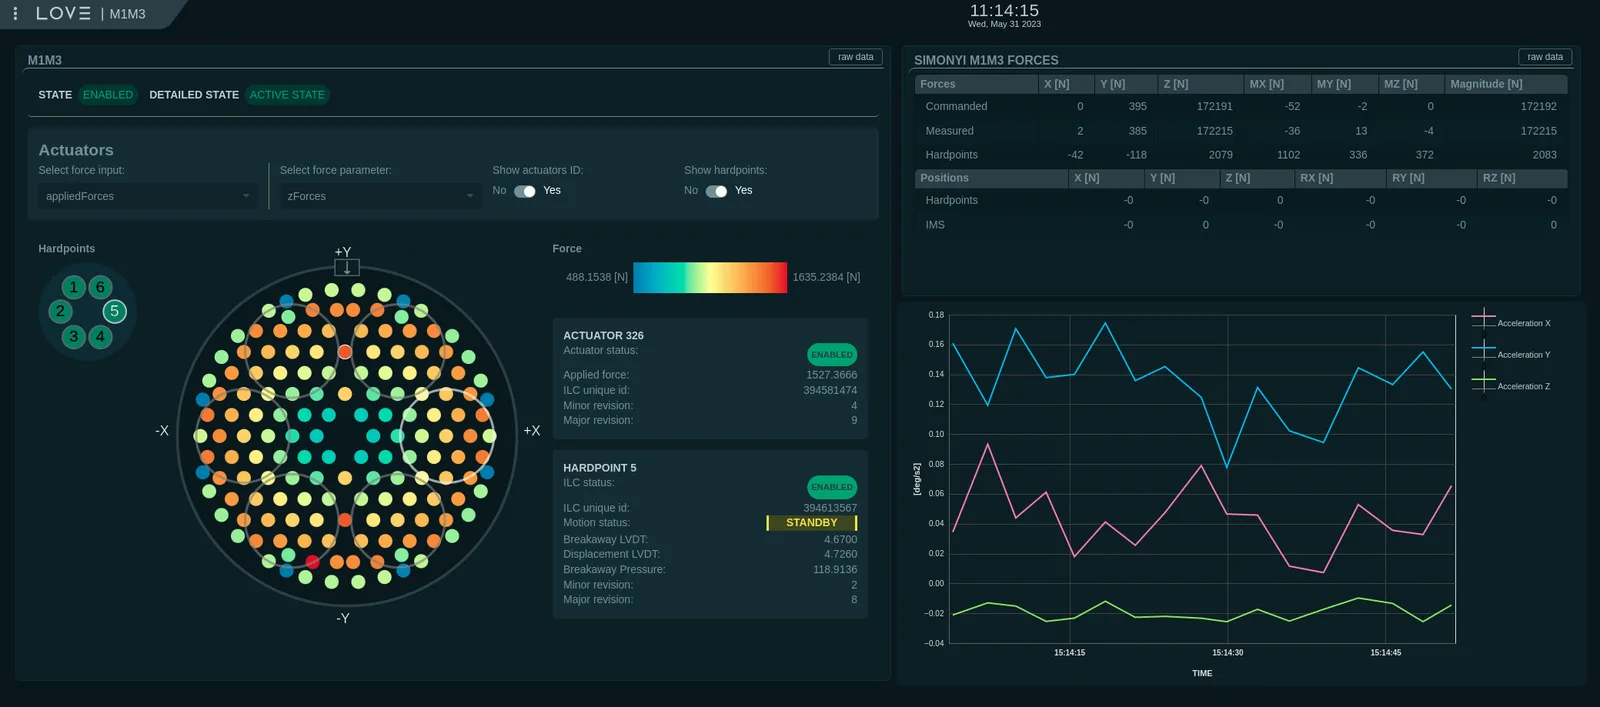
The L.O.V.E. M1M3 view: hundreds of mirror actuators coloured by force, with one actuator's details and live accelerations.
65+systems monitored from one environmentL.O.V.E.
40+components designedL.O.V.E., 2017–2021
20 TBof data a night, once operatingRubin Observatory
4.5years, across two contractsInria Chile

A telescope that will photograph the whole southern sky every few nights

The Vera C. Rubin Observatory, on Cerro Pachón in Chile, carries the largest digital camera ever built for astronomy: 3.2 gigapixels, covering 9.6 square degrees per image. Operators will run it from a control room that monitors more than 65 systems.

L.O.V.E. (LSST's Operation and Visualization Environment) is that control room's interface. Inria Chile and Inria France designed and built it with Rubin's team.

Lead designer, from the first prototypes to the framework

I led the design across both phases: research with telescope experts, the component method, the interface and the UI framework. I worked with three developers, a project manager and a research intern, and proposed a layout for the control room itself: shared screens and workstations.

Designing for users, data and hardware that didn't exist yet

When we started in 2017, the telescope was being built. There were no operators to watch, no live data and few final requirements. Engineers knew their own subsystem deeply, but nobody had seen the whole control room working.

Older telescopes spread monitoring across many tools and information sources. That raises the cognitive load, lengthens the learning curve, creates inconsistencies and slows the response when something goes wrong.

L.O.V.E. had three goals: give operators both high- and low-level data for more than 65 systems; keep the equipment and the people in the dome safe; and help experts act quickly on anything that could ruin a night's observations.

And it had to work through years of change: dummy data instead of real data, evolving technology, shifting priorities, team turnover and construction delays, on the way to a ten-year survey.
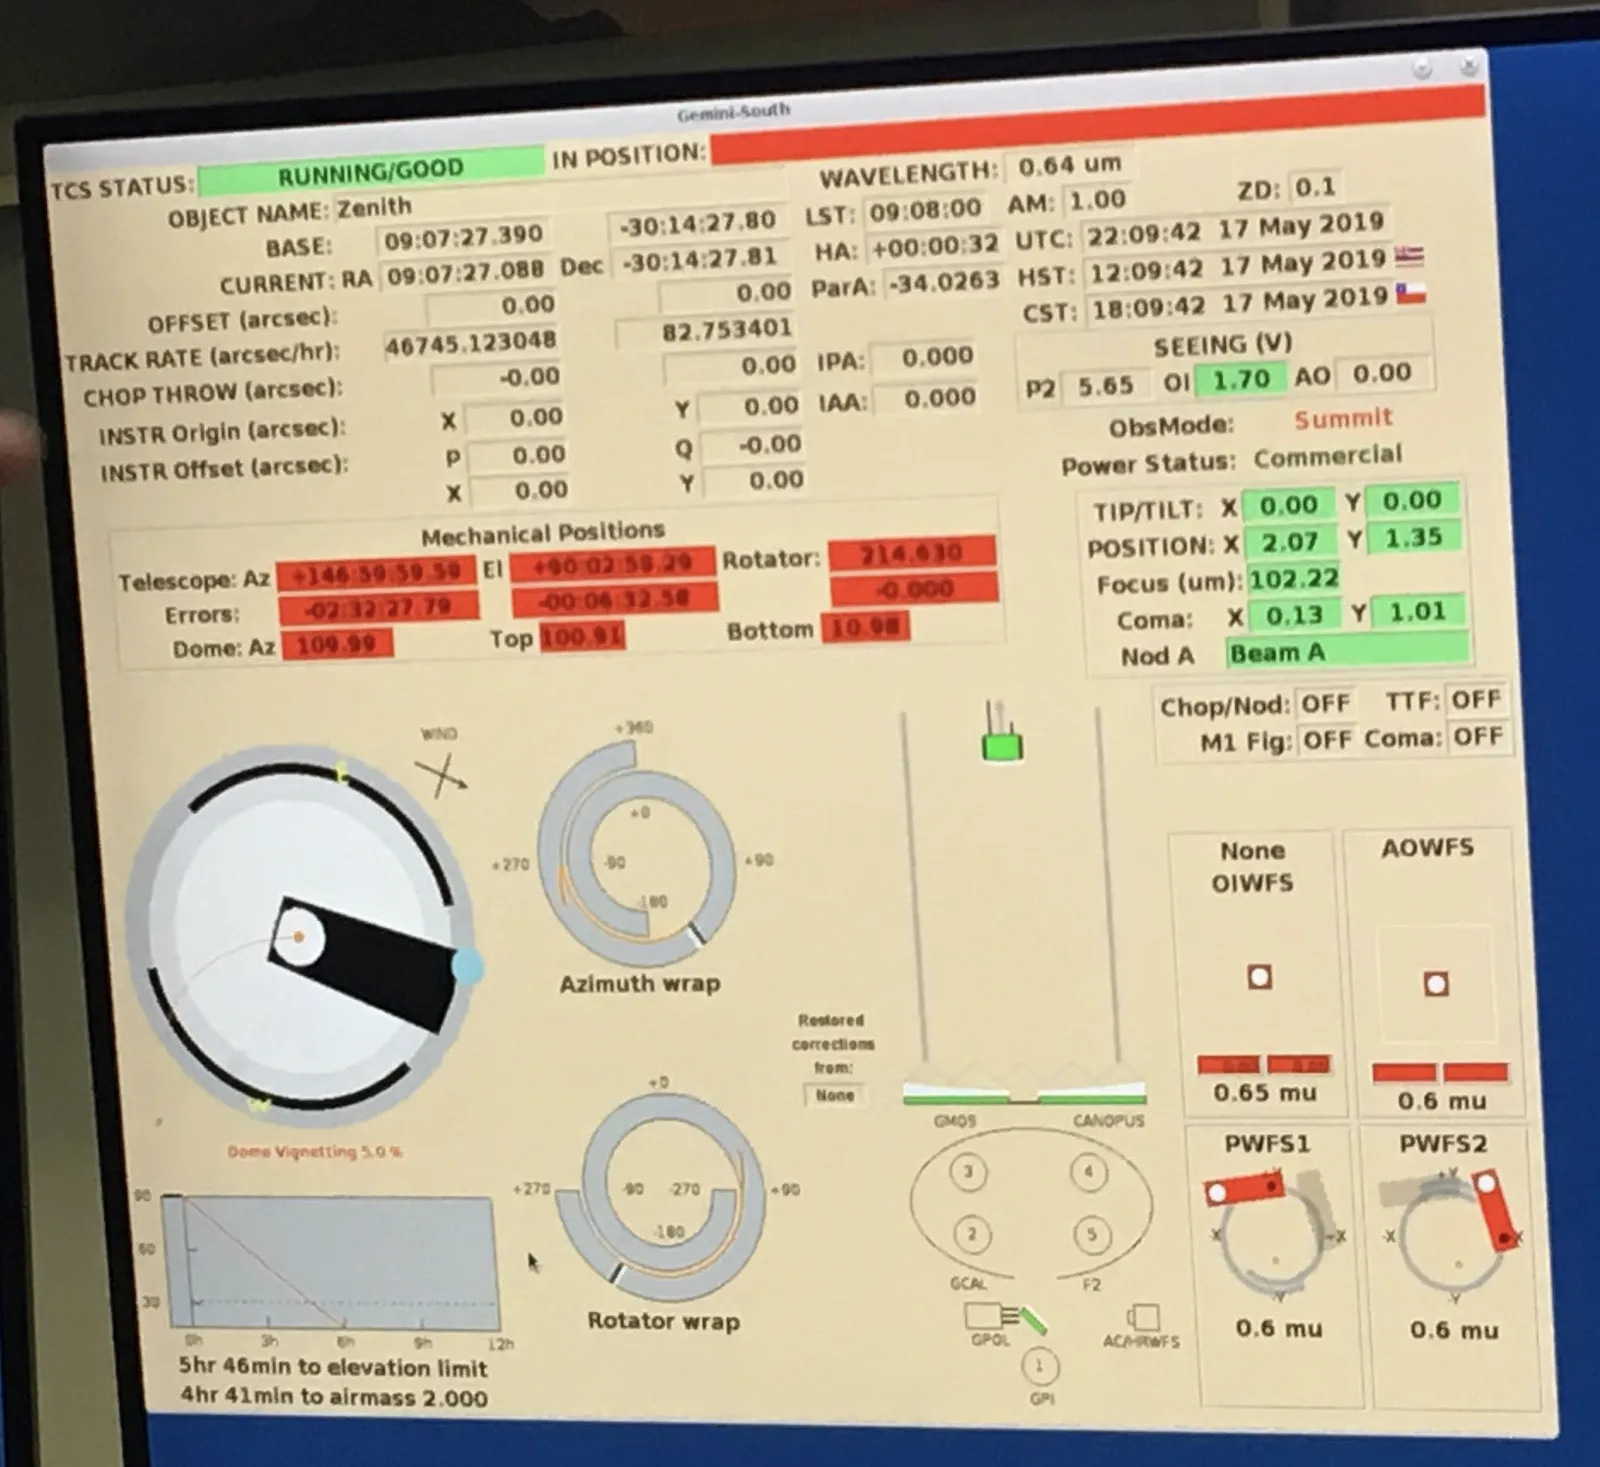
A photo of a monitoring screen at an older telescope: dense fields of coordinates, red and green status boxes, and small dials for the dome and rotators.
Before. A monitoring screen at an older telescope (Gemini South): one of many tools an operator watches at once.FIG. 01

A method for each component

Without users to observe, I built a repeatable method. Every component went through seven steps:
  1. LearnRead the documentation, XML and databases, then interview the subsystem's experts.
  2. DiscussDiscuss it as a team, then sketch together.
  3. DesignWireframes, then mockups, reviewed with the experts.
  4. BuildImplementation with the developers, and back to experts for feedback.
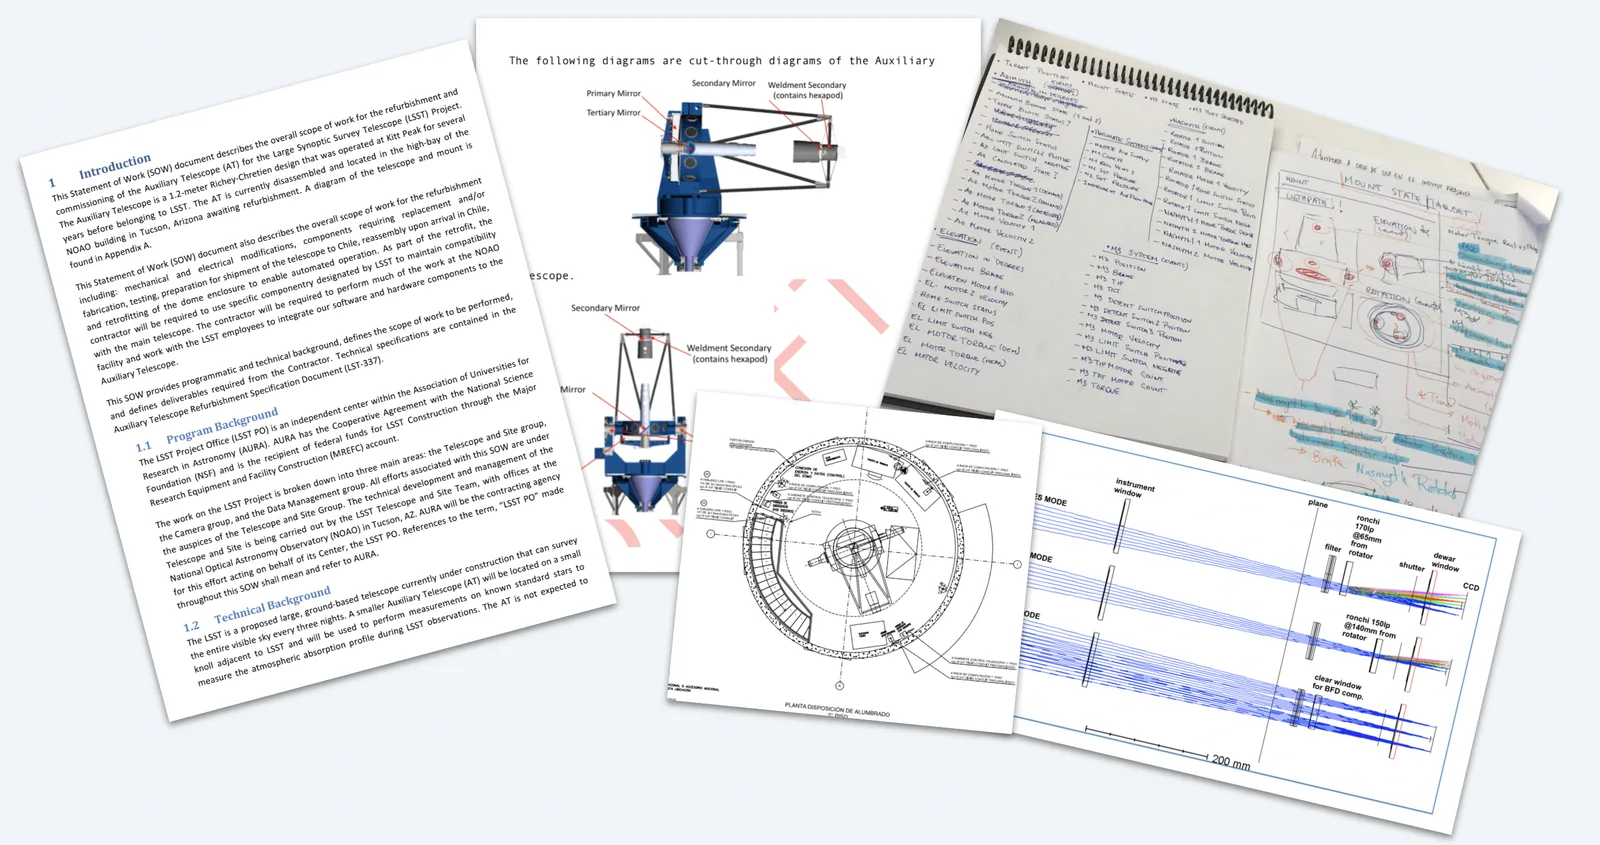
A collage of research material: a statement of work, cut-through diagrams of the auxiliary telescope, a dome floor plan, an optical diagram, and handwritten notebook pages listing telemetry and events.
Learn. Specifications, diagrams and floor plans, and my notes listing each subsystem's telemetry and events.FIG. 02
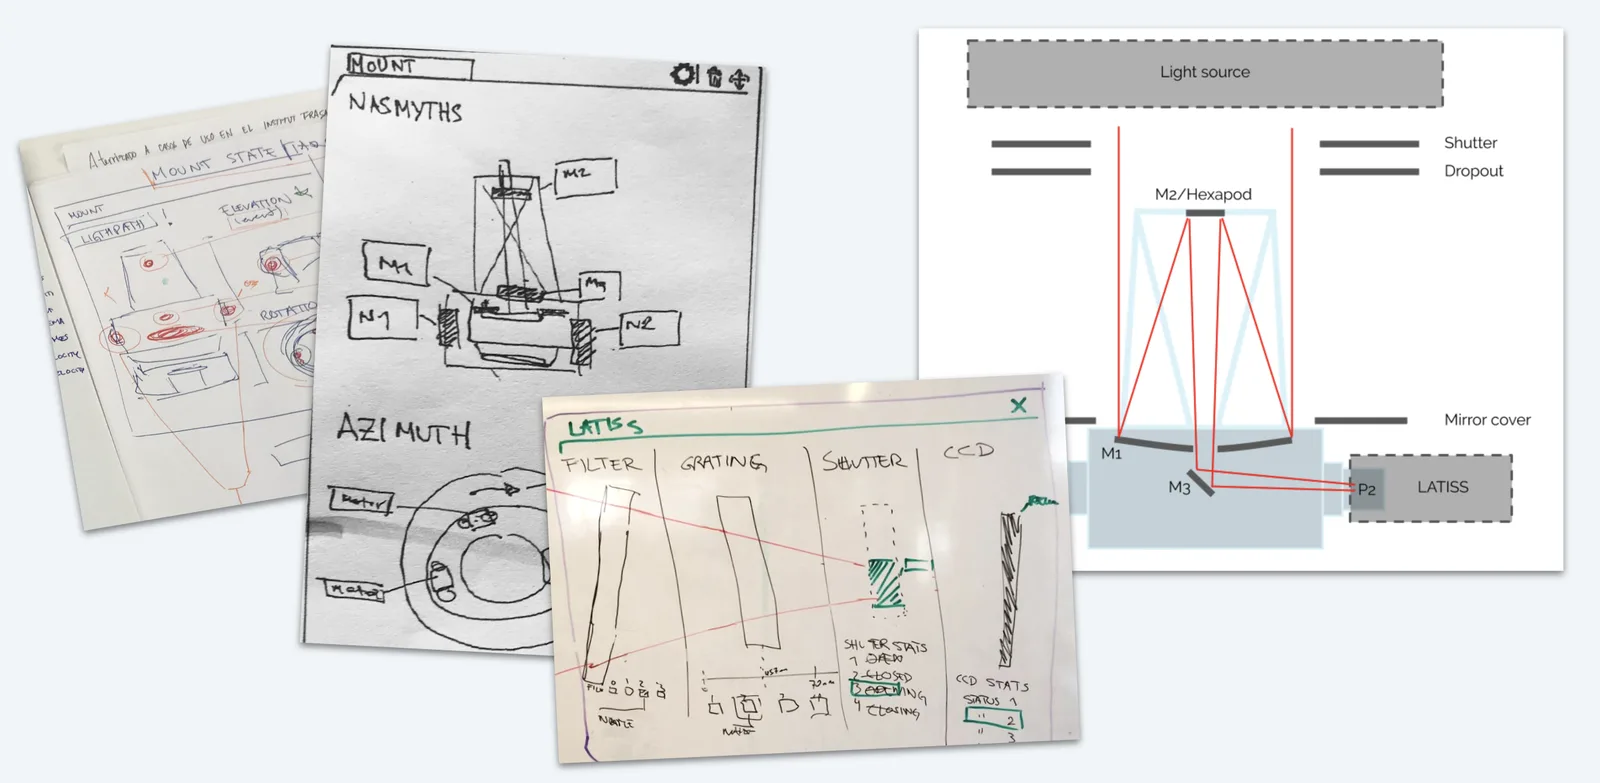
Hand sketches of the mount, Nasmyth ports, azimuth and the LATISS spectrograph on paper and a whiteboard, beside a clean wireframe of the telescope's light path.
Sketch and wireframe. Team sketches on paper and whiteboard, then a wireframe of the light path.FIG. 03
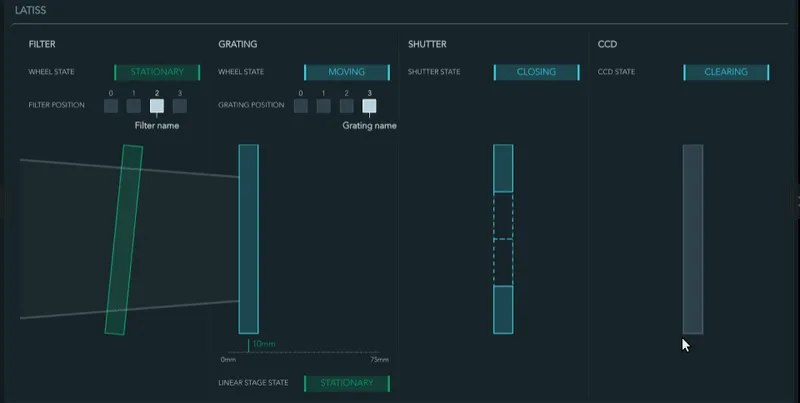
The LATISS component: filter, grating, shutter and CCD in sequence, each with its state, along the path the light travels.
Mockup. LATISS, the spectrograph, read in the order the light reaches it.
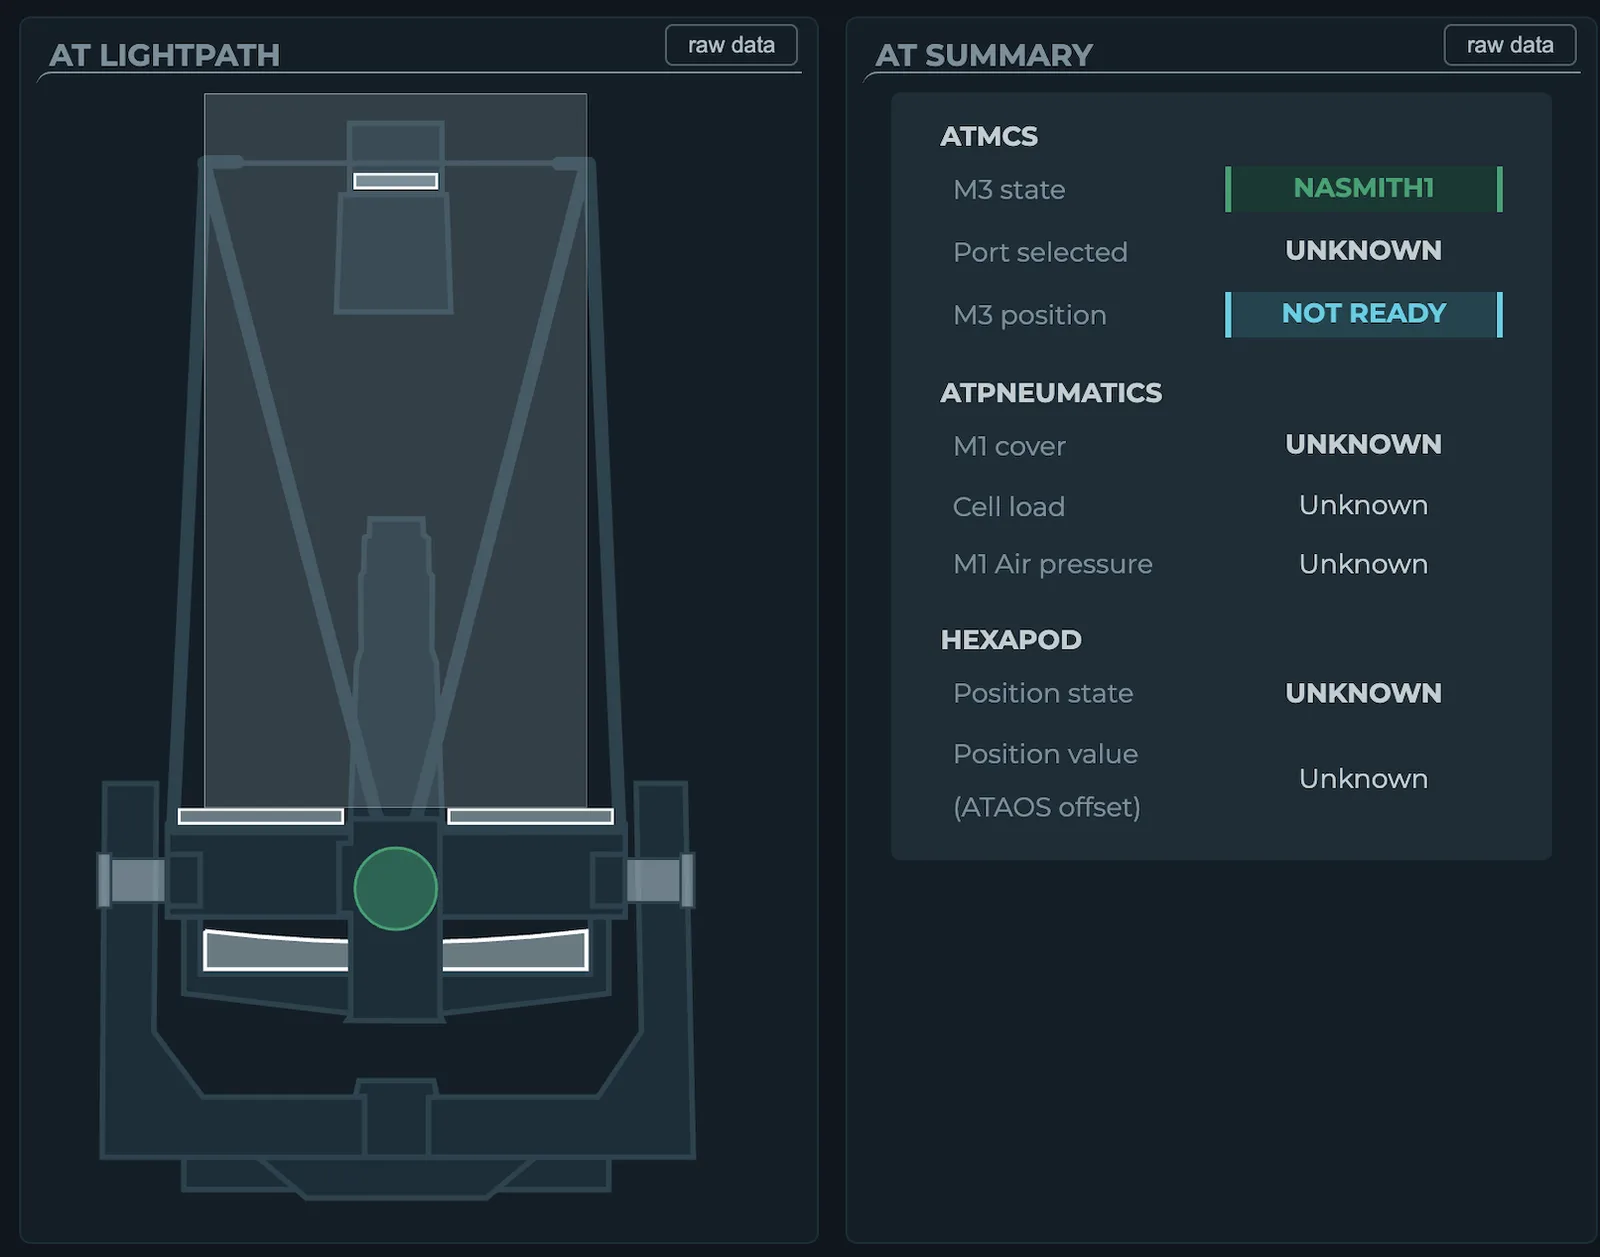
The auxiliary telescope's light path drawn as a schematic, beside a summary of mirror, pneumatics and hexapod states.
Mockup. The light path, with each part's state beside it.
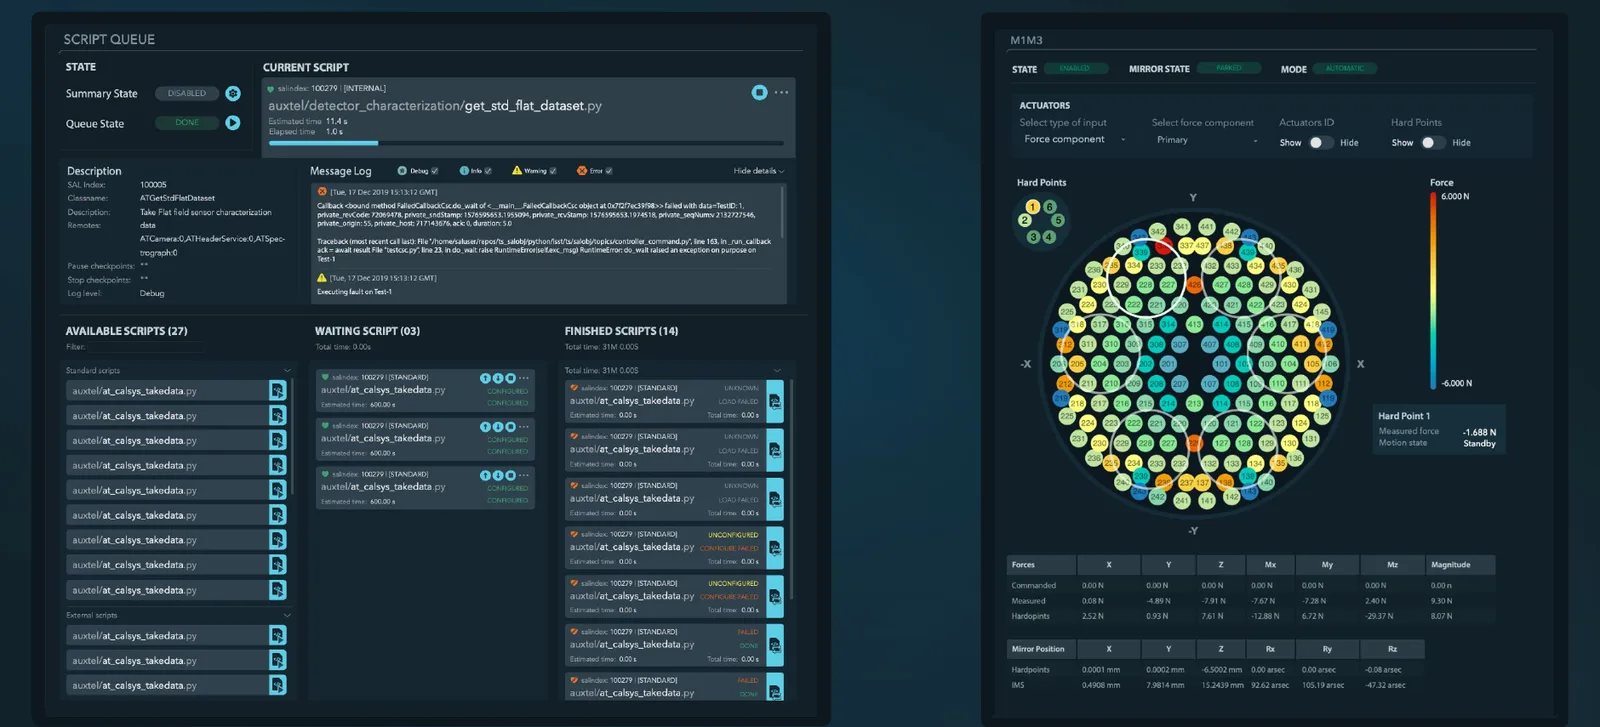
Two L.O.V.E. components on a dark interface: the ScriptQueue with running, waiting and finished scripts, and the M1M3 mirror's actuators coloured by force.
Built. The ScriptQueue, which sends commands to the telescopes, and the M1M3 mirror's actuator forces.FIG. 04

Build a framework, not a fixed screen

Prototype to find the requirements

Discovery

In phase one (2017–2018), prototypes in front of experts surfaced requirements that documents couldn't.

A UI framework operators can compose

System

Operators build their own views from components, so Rubin can extend L.O.V.E. over its ten-year plan without us.

Fix the colour scale on M1M3

Data viz

The existing force map's colour scale hid the values engineers needed. I redesigned its colour scale so engineers could read the forces they needed at a glance.

Design the room, not only the screens

Scope

I proposed the control room layout: which screens are shared, which are personal.
The views operators use

The M1M3 view: a map of the mirror's actuators coloured by force on a continuous scale, details for one actuator and one hardpoint, a forces table and an acceleration chart.
M1M3, the primary mirror. Hundreds of actuators coloured by force, with the selected actuator's details and live accelerations.FIG. 05
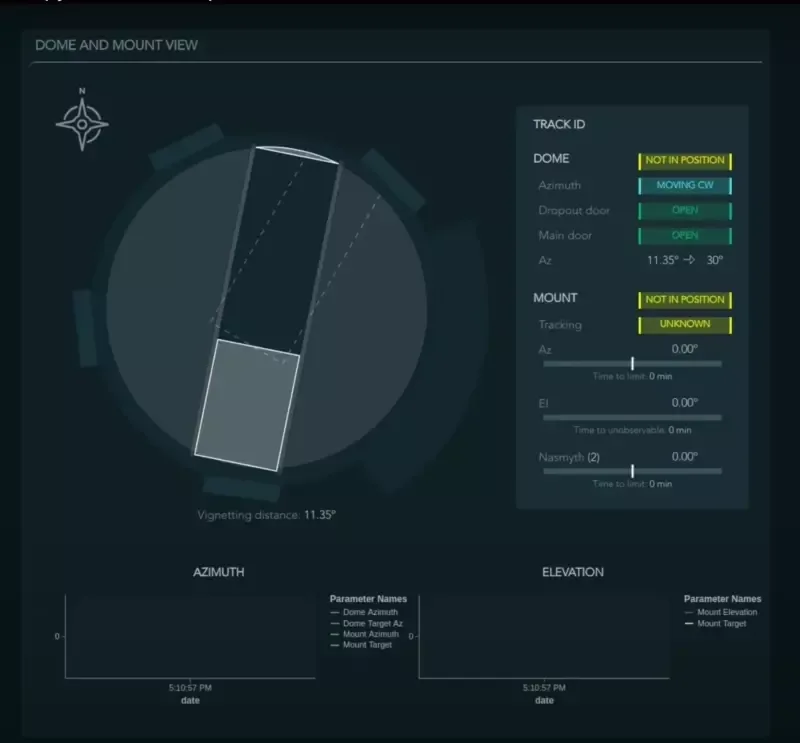
The dome and mount view: the telescope drawn inside the dome from above, with dome and mount states, door states and time to limits.
Dome and mount. Whether the telescope can see through the dome slit, and how long until a limit.
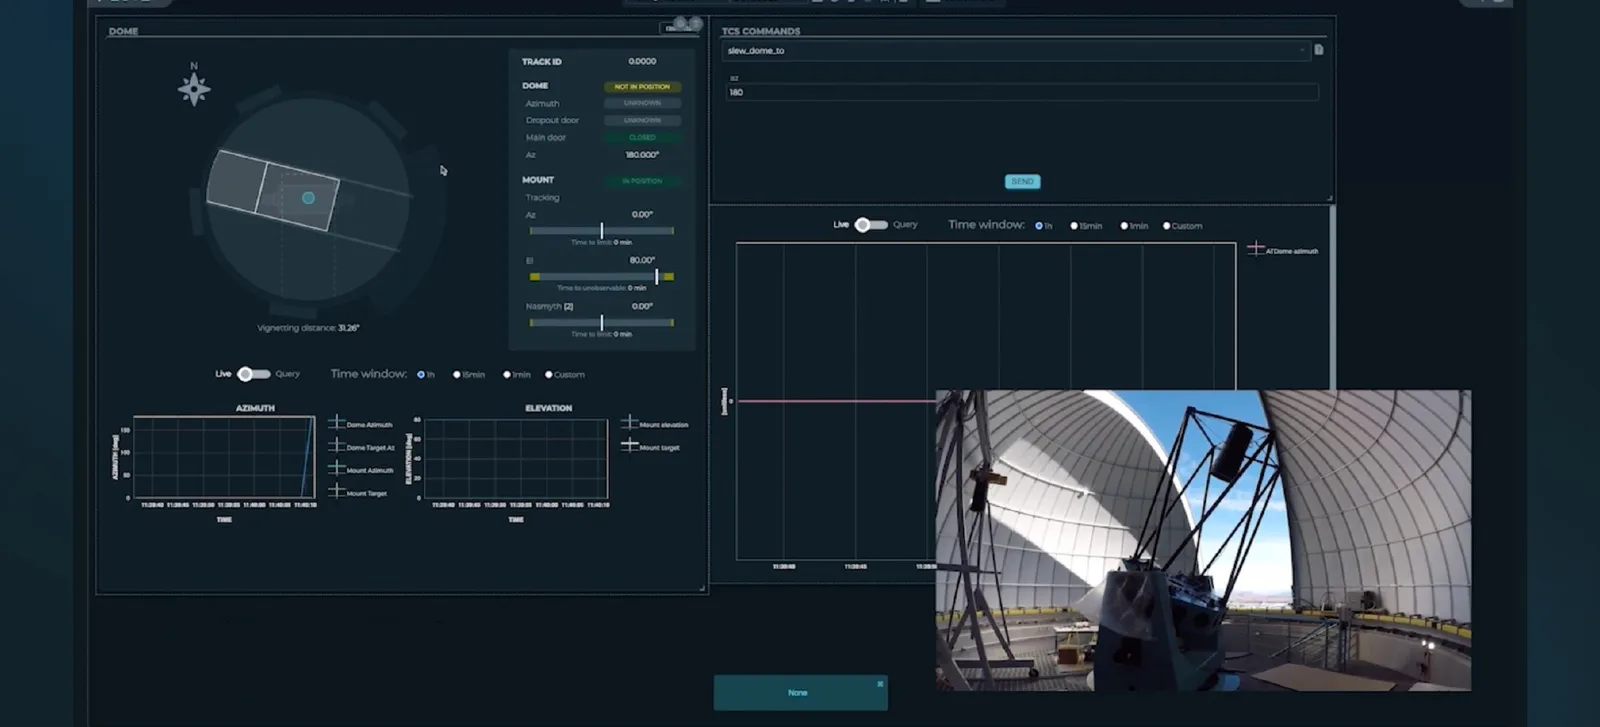
The auxiliary telescope view: the dome and mount positions, their azimuth and elevation over time, and the live camera image of the telescope inside the dome.
Auxiliary telescope. Dome and mount in motion, with the live camera.
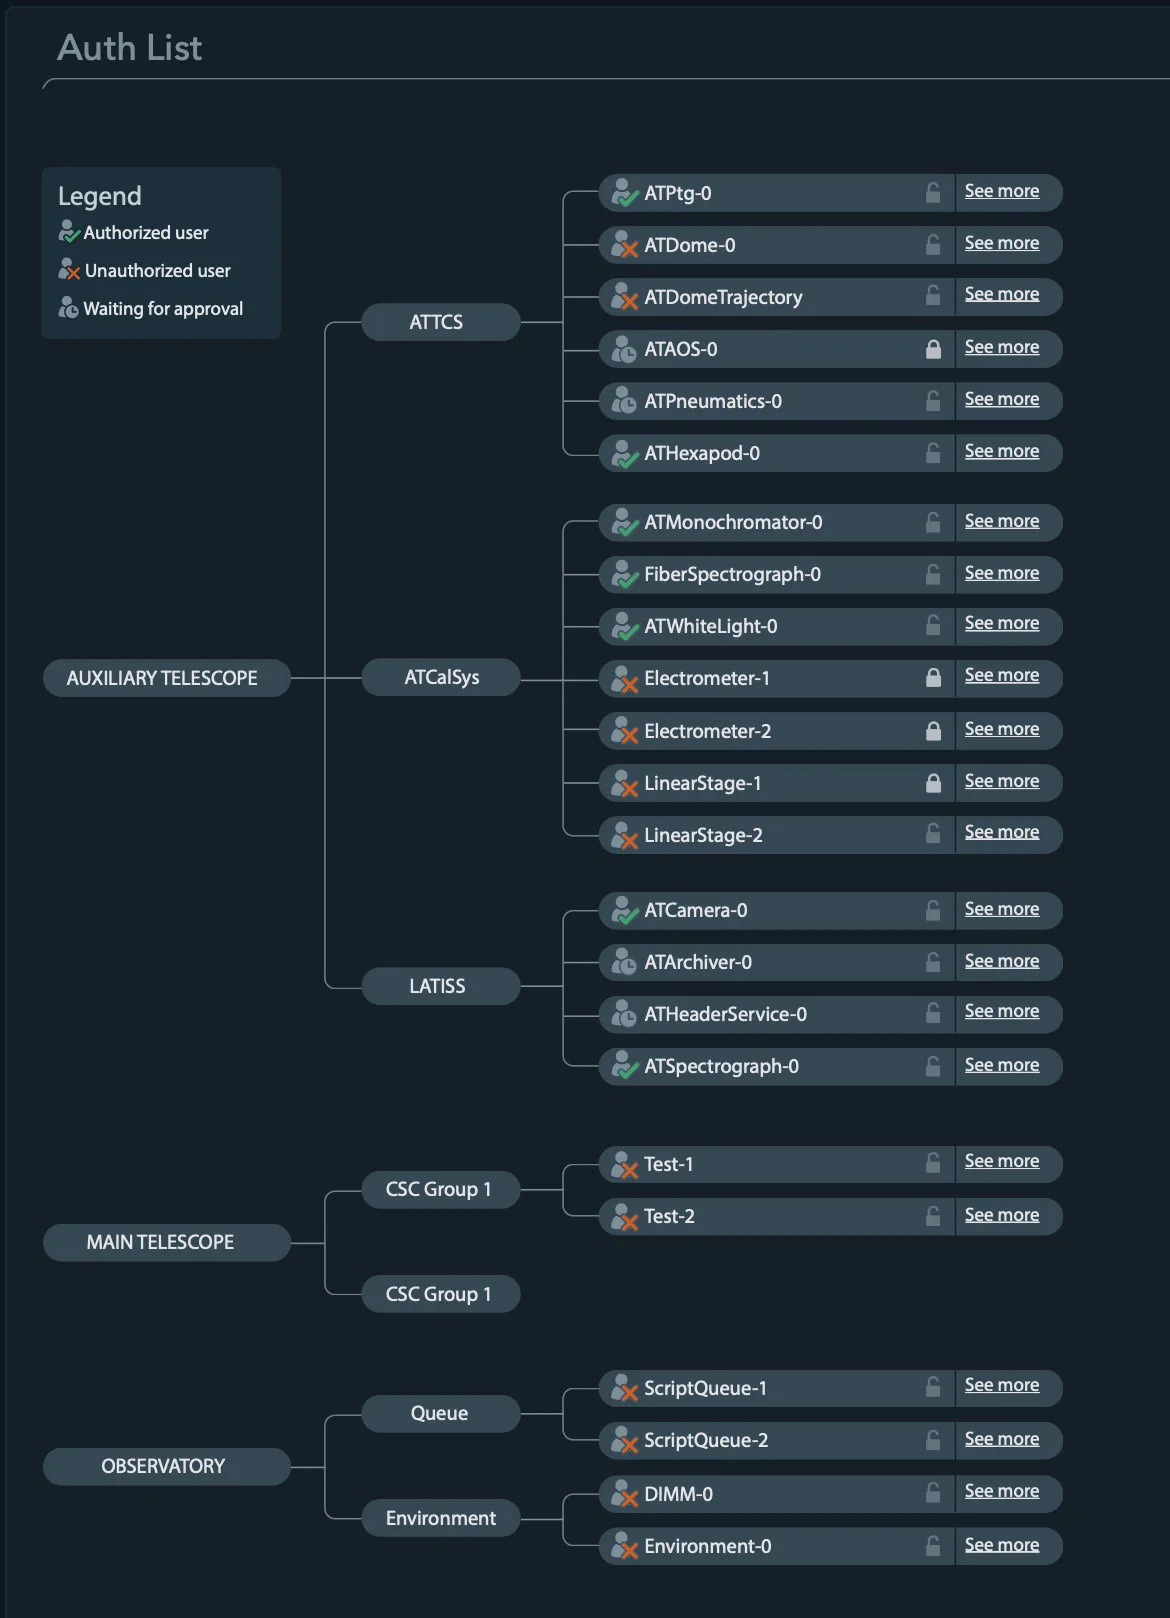
The authorization list: a tree of telescopes, groups and components, each marked as authorized, unauthorized or waiting for approval.
Authorization list. Who may command which component, at a glance.
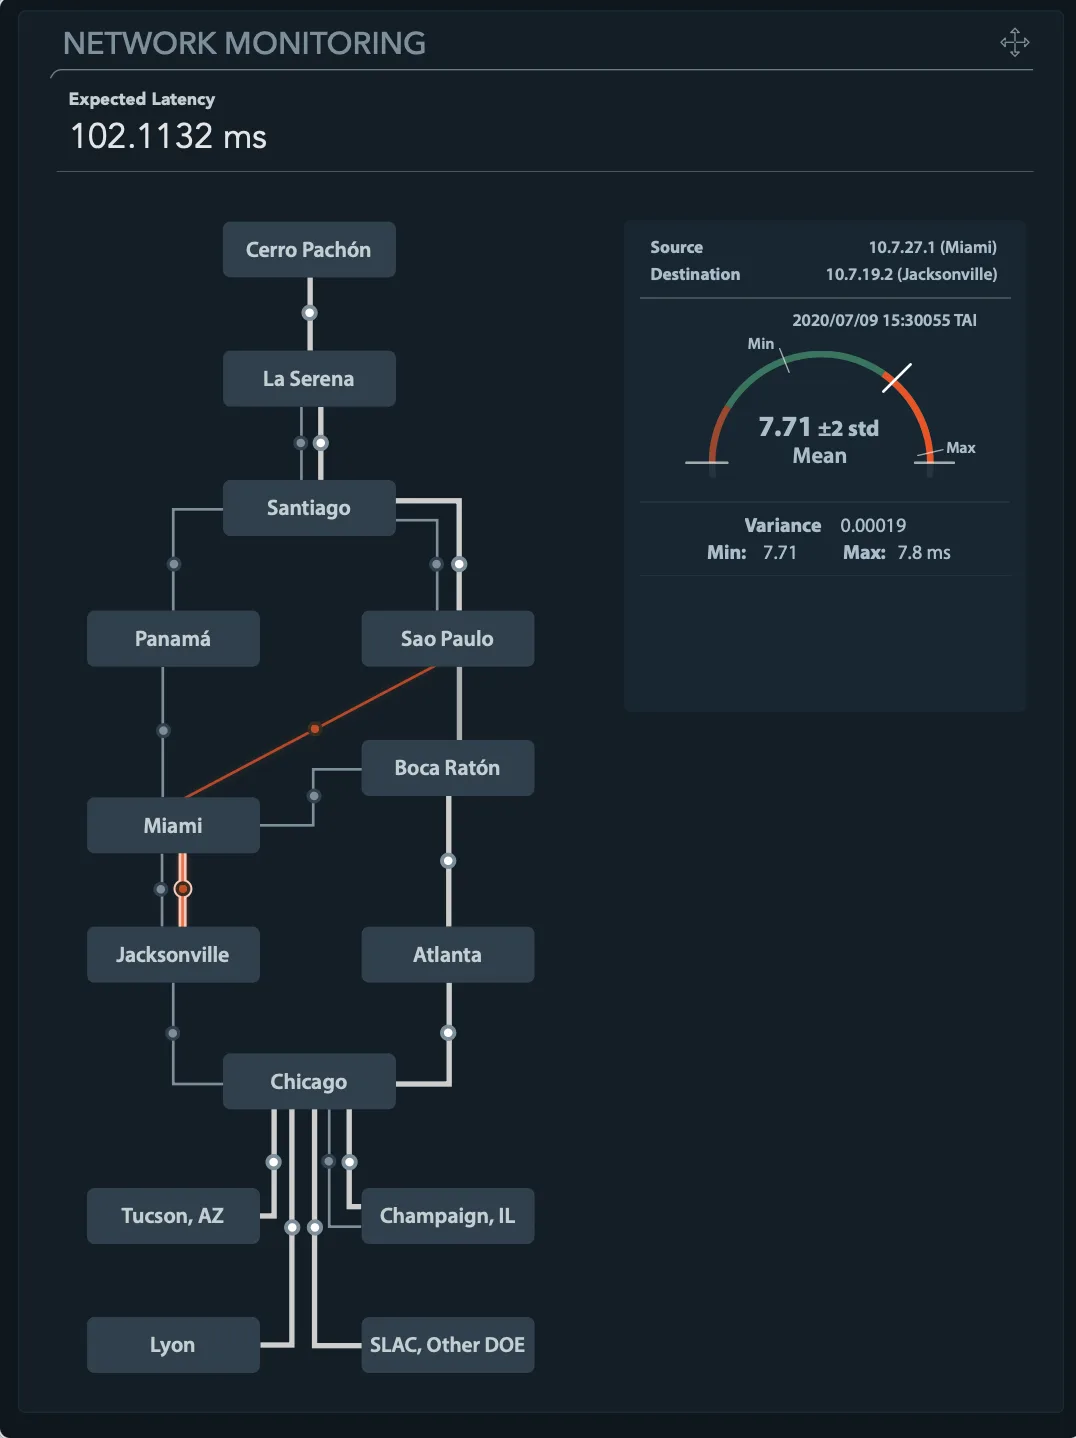
Network monitoring: the data route from Cerro Pachón through Santiago to the United States and France, with one link highlighted and its latency on a gauge.
Network monitoring. The data's route from the mountain to the world, and its latency.
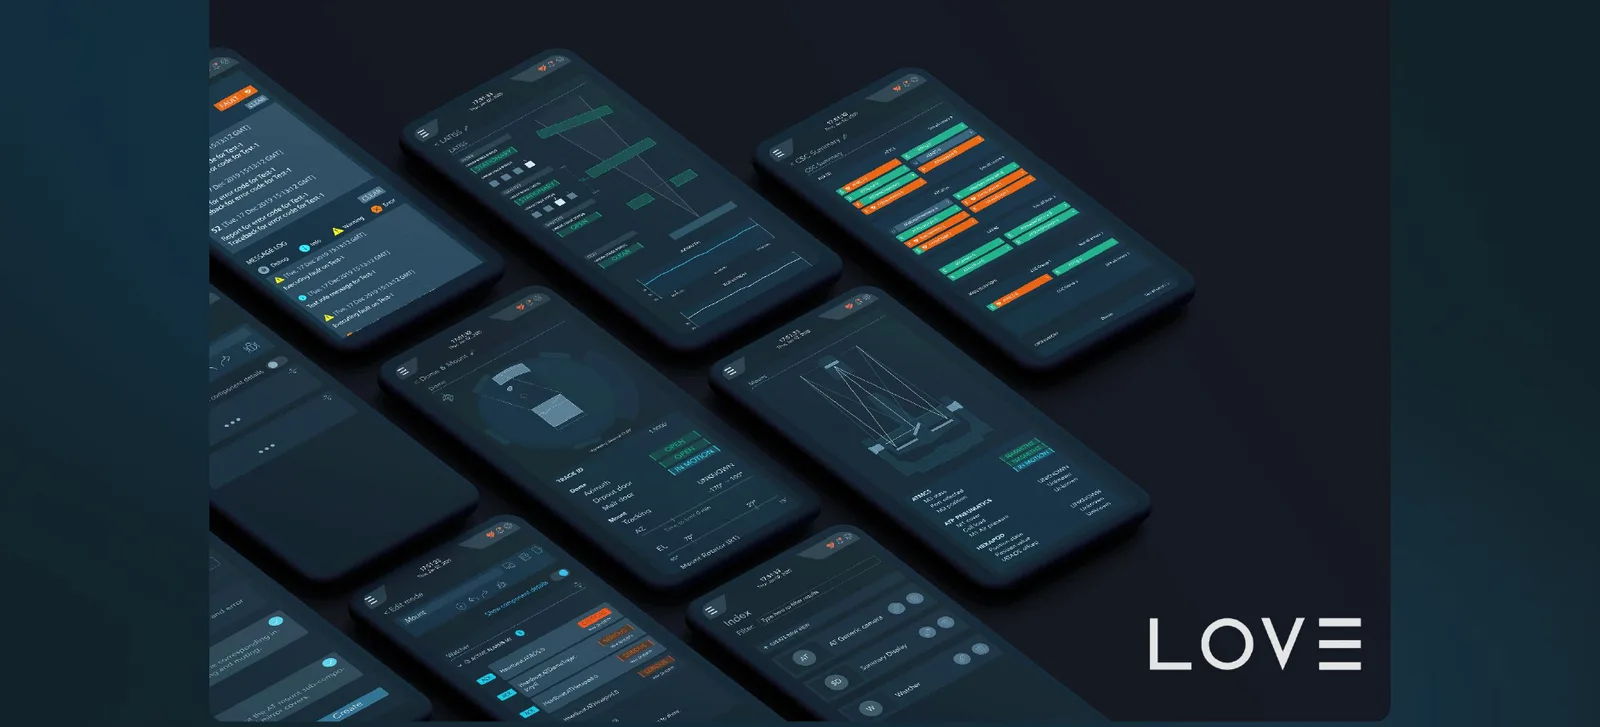
A set of phone screens showing L.O.V.E. components adapted for mobile monitoring.
Mobile proof of concept. Monitoring components adapted for phones.FIG. 06

A framework Rubin's team now extends

  • More than 65 systems monitored from one environment.
  • 40+ components, documented with interaction rules and functional specs.
  • After my part ended in 2021, the work continued to 2023 on the framework, the main telescope and new tools.

What I'd do differently

What worked

A method for each component kept the work moving when the users and the hardware weren't there yet.

What I'd change

Without operators to observe, the experts stood in for users. I'd test earlier with the people who will run the telescope at night, even in simulation.